Sales Dashboard
Your daily business snapshot — sales, orders, expenses, and top performers at a glance.
Overview
The Sales Dashboard is your primary daily view. It answers the most common questions a restaurant owner or manager asks: How much did we sell today? Who sold the most? What's our cash position?
Open this page at the start or end of each day to review performance. Use the date picker in the top-right to look at any previous day or date range.
TIP
This page is available to Admin users only. Staff with Operator or Cashier roles will land on System Health instead.
What You'll See
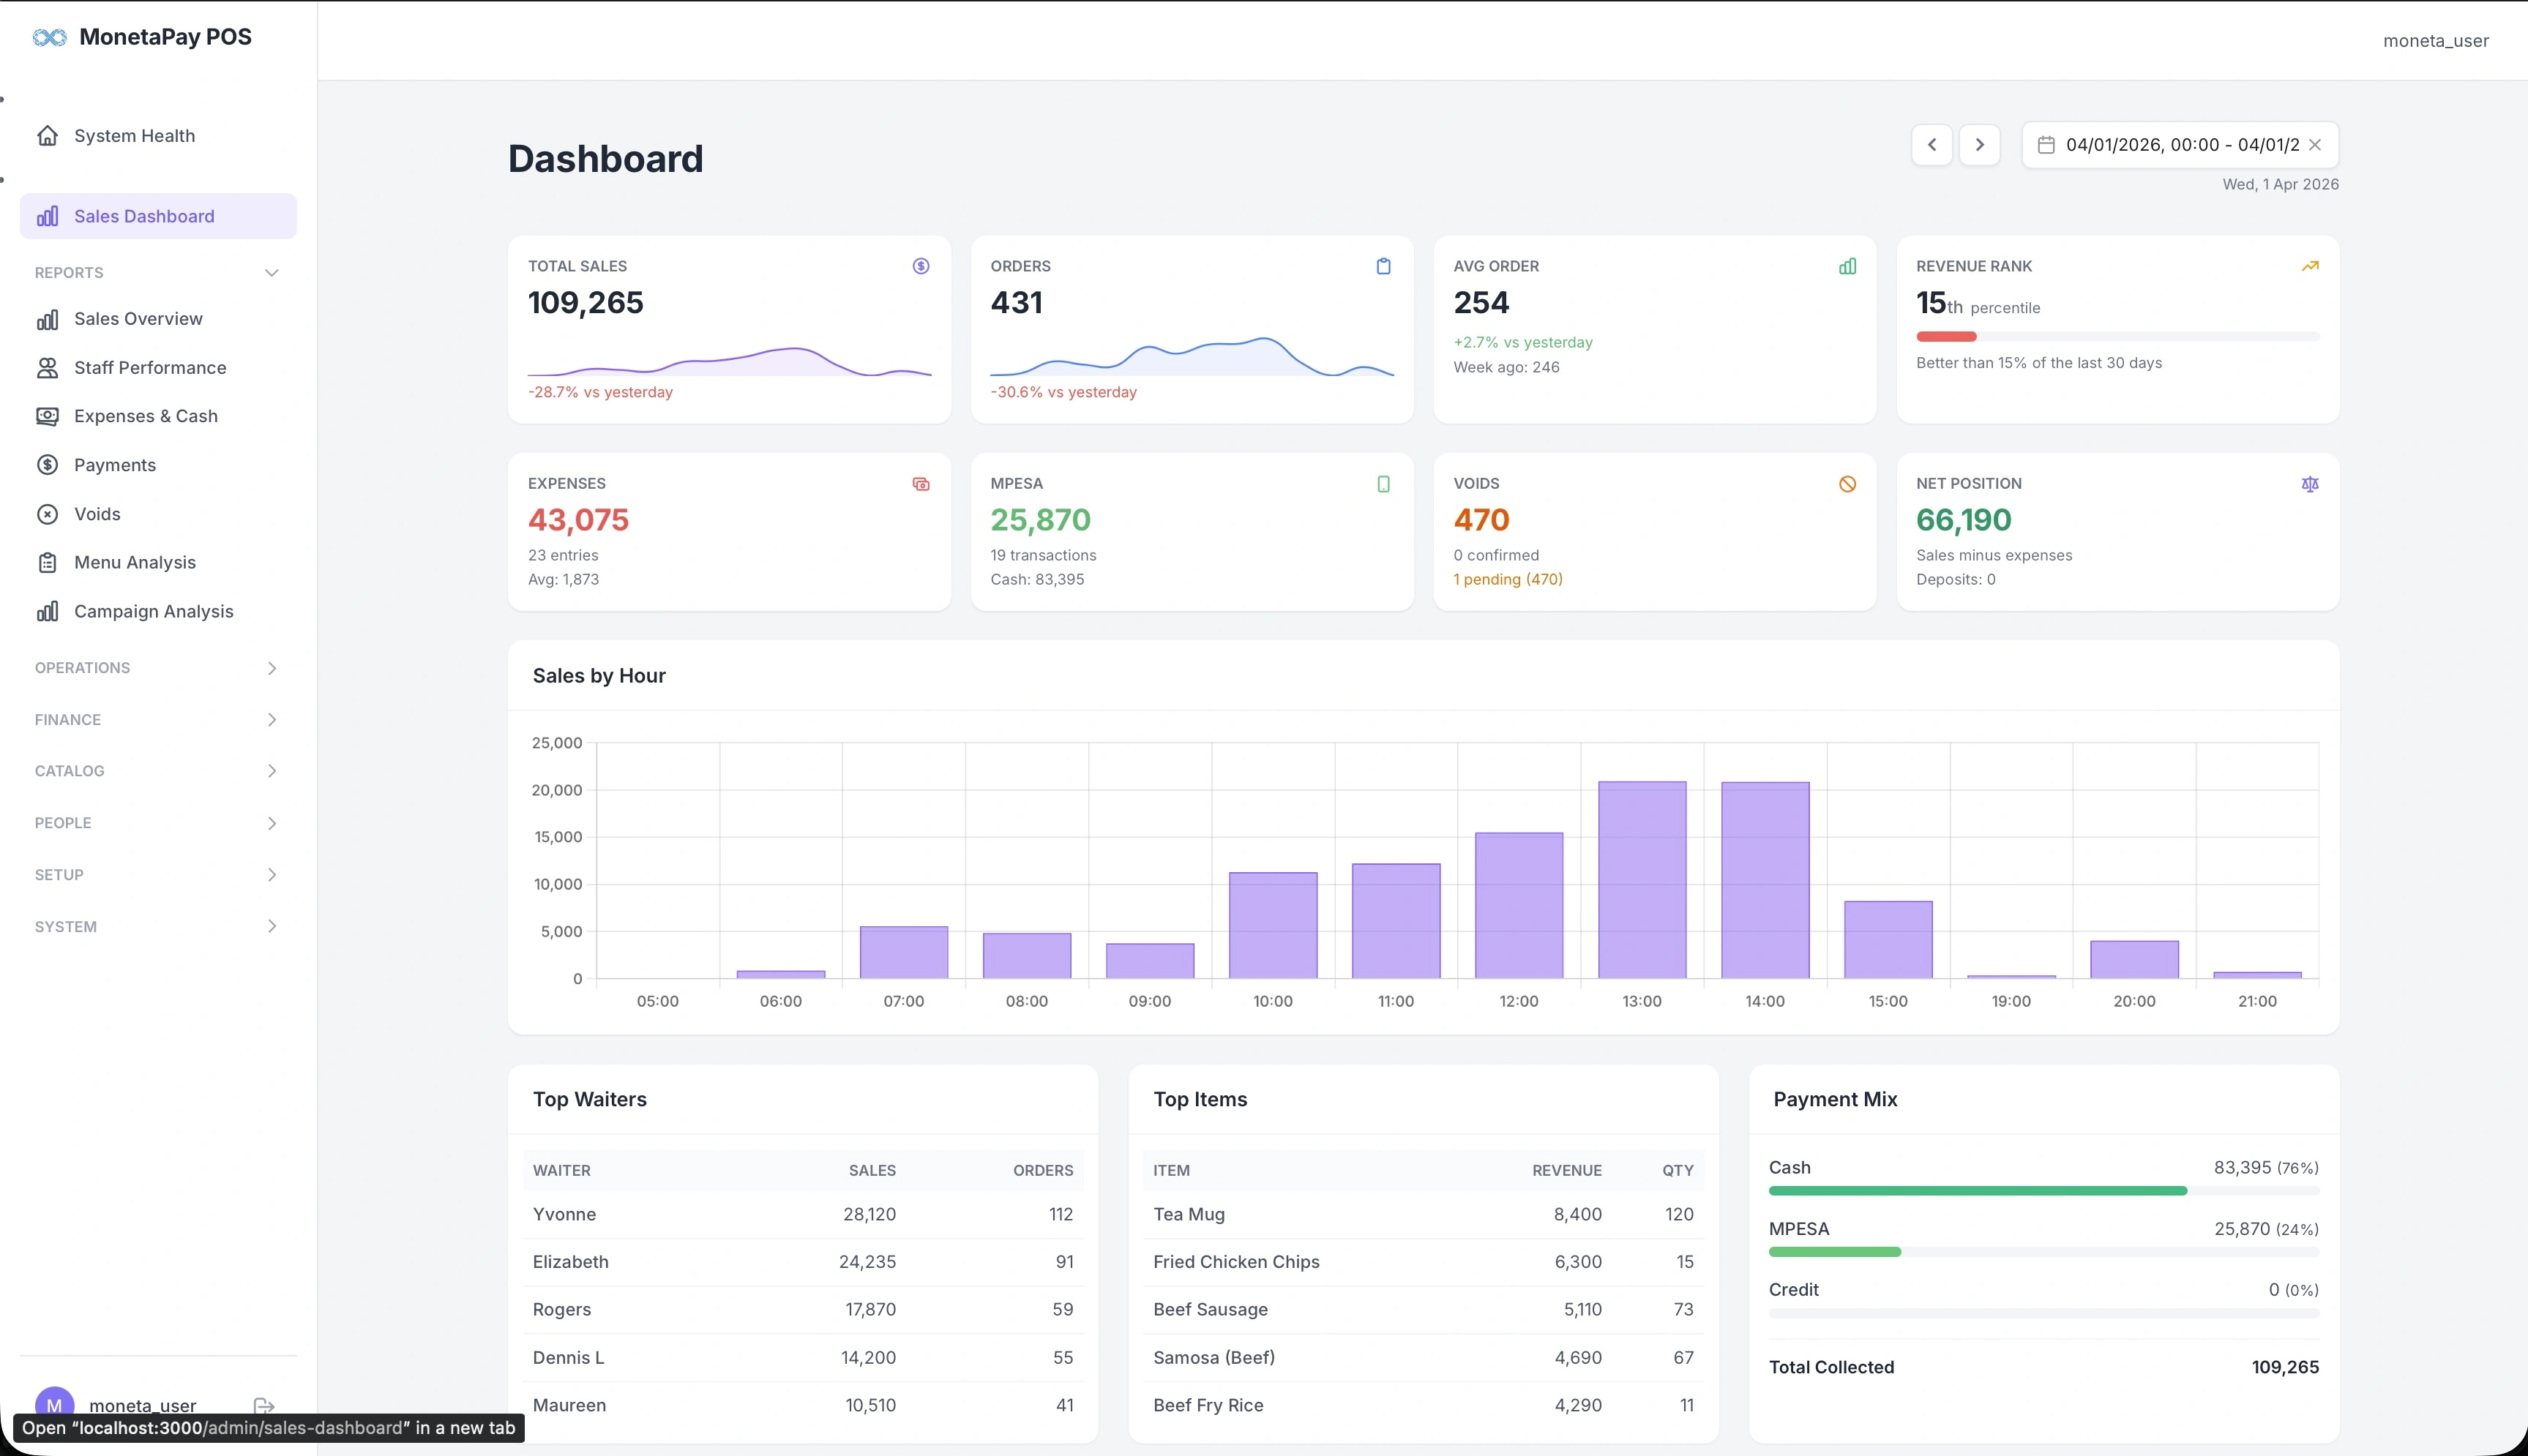
KPI Cards — Top Row
The first row shows your core sales metrics with trend indicators:
| Card | What It Shows |
|---|---|
| Total Sales | Revenue for the selected period, with a sparkline trend and percentage change vs yesterday |
| Orders | Total order count with sparkline trend and change vs yesterday |
| Avg Order | Average order value, with comparison to the same day last week |
| Revenue Rank | Your percentile ranking over the last 30 days — quickly see if today is above or below average |
KPI Cards — Second Row
The second row covers expenses, payments, and your net cash position:
| Card | What It Shows |
|---|---|
| Expenses | Total expenses with entry count and average per entry |
| MPESA | Mobile money collected, transaction count, and cash equivalent |
| Voids | Value of voided orders, showing confirmed and pending counts |
| Net Position | Sales minus expenses — your bottom line for the day, with deposit tracking |
Sales by Hour
A bar chart showing revenue distribution across each hour of the day. Use this to:
- Identify your peak hours (lunch rush, dinner service)
- Spot quiet periods where you might reduce staffing
- Compare today's pattern against what you'd expect
Quick Rankings
Three summary tables at the bottom of the page:
- Top Waiters — Your top 5 waiters ranked by sales revenue, with order count. Quickly see who's driving the most business.
- Top Items — Best-selling menu items by revenue and quantity sold. Useful for confirming popular items are in stock.
- Payment Mix — Breakdown of cash vs M-PESA vs credit, with percentages and a visual bar. Helps with cash management and reconciliation planning.
Date Navigation
Use the controls in the top-right corner:
- Arrow buttons — step forward or backward by one day
- Date picker — click to select any date or date range
- Refresh — reload data for the current selection