Sales Overview
Detailed sales breakdown with period comparisons, receipt statistics, and per-staff performance.
Overview
Sales Overview gives you a deeper look at your sales numbers than the main dashboard. It's where you go to compare today's performance against yesterday, last week, or last month — and to see how sales are distributed across waiters, cashiers, and POS terminals.
Use this page when you need to:
- Compare current performance against previous periods
- Understand receipt value distribution (median, min, max)
- See sales broken down by waiter, cashier, or terminal
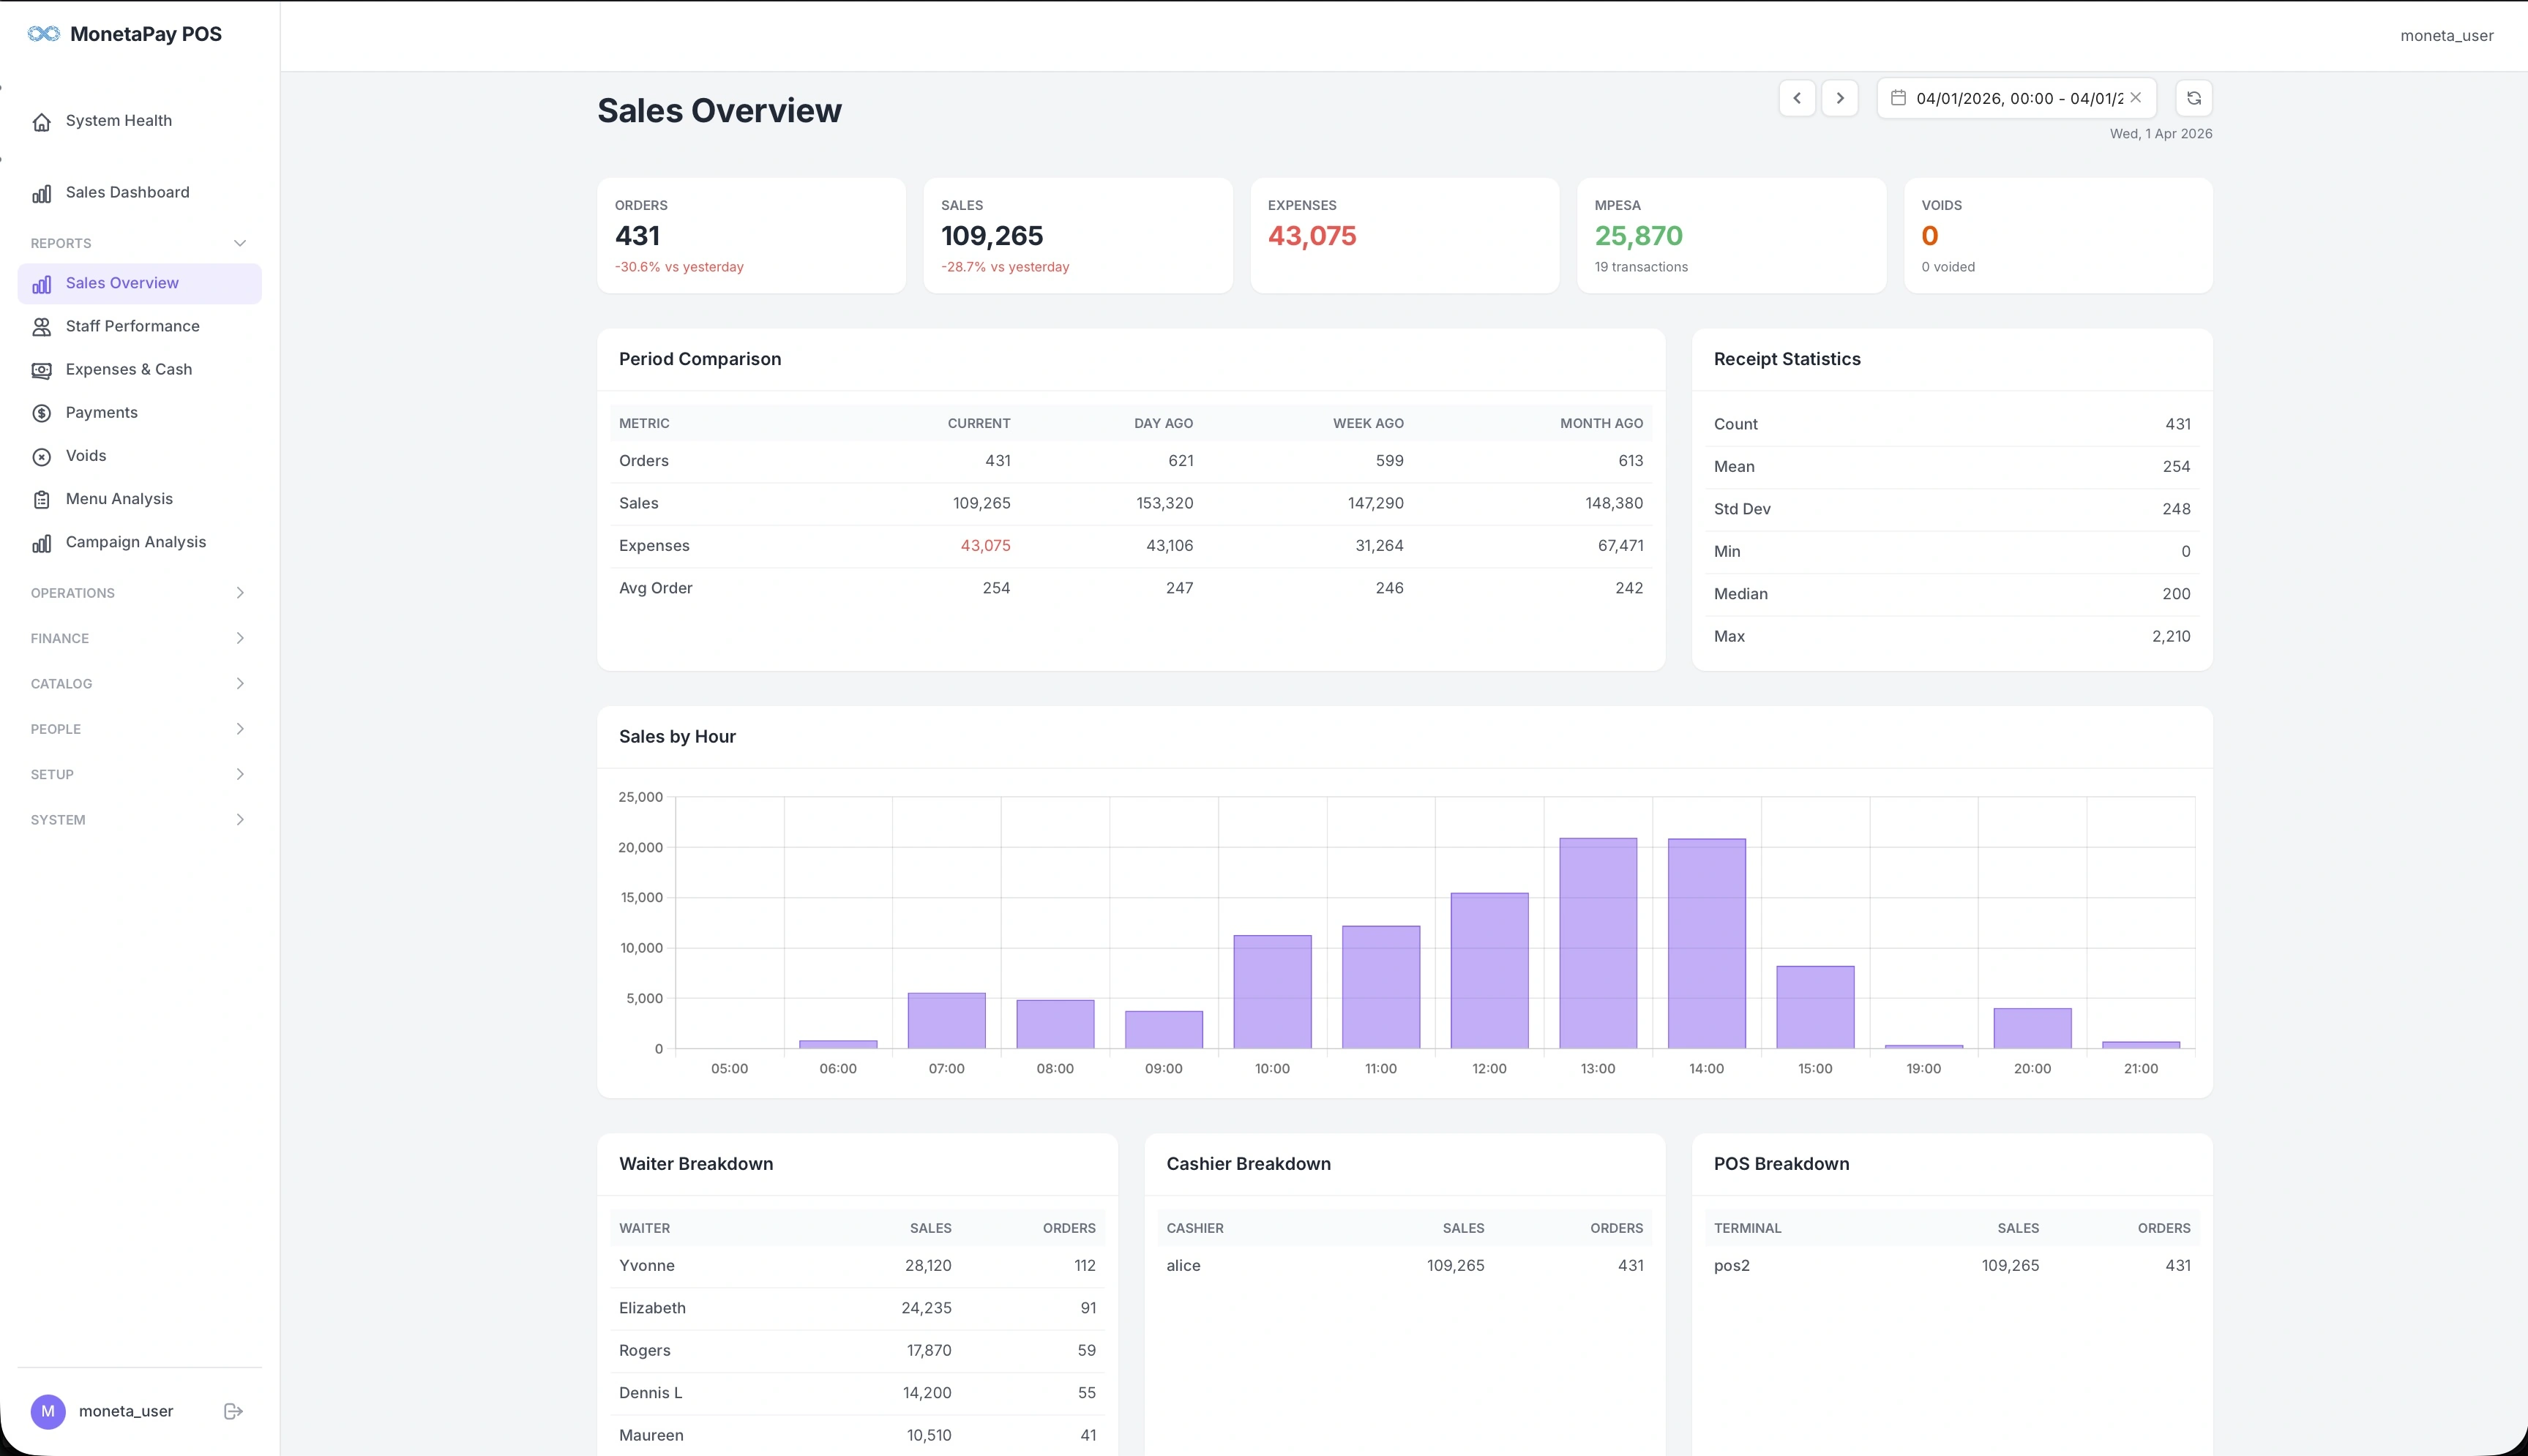
What You'll See
KPI Cards
Five summary cards across the top:
| Card | What It Shows |
|---|---|
| Orders | Total order count with change vs yesterday |
| Sales | Total revenue with change vs yesterday |
| Expenses | Total expenses for the period |
| MPESA | M-PESA collected with transaction count |
| Voids | Voided order count |
Period Comparison
A table comparing your key metrics across multiple time windows:
| Column | Description |
|---|---|
| Current | The selected date range |
| Day Ago | Same metrics from the previous day |
| Week Ago | Same day last week |
| Month Ago | Same day last month |
Metrics compared: Orders, Sales, Expenses, and Average Order value. Use this to spot trends — are sales growing week over week? Is your average order value holding steady?
Receipt Statistics
A statistical summary of your order values:
| Stat | What It Tells You |
|---|---|
| Count | Total receipts |
| Mean | Average order value |
| Std Dev | How much order values vary — a high number means a wide mix of small and large orders |
| Min / Max | Smallest and largest order |
| Median | The middle order value — often more useful than the mean if you have a few very large orders |
Sales by Hour
A bar chart showing hourly revenue distribution. When viewing a multi-day range, a daily sales trend chart is also shown.
Breakdown Tables
Three side-by-side tables at the bottom:
- Waiter Breakdown — Each waiter's sales total and order count
- Cashier Breakdown — Each cashier's sales total and order count
- POS Breakdown — Sales per terminal, useful for multi-terminal setups
These tables help answer questions like "Which terminal processed the most orders?" or "How do waiter sales compare to cashier sales?"