Menu Analysis
Understand which menu items drive revenue and which underperform.
Overview
Menu Analysis helps you make data-driven decisions about your menu. It shows which items sell the most, which generate the most revenue, and how sales break down by category.
Use this page to:
- Identify your best sellers and ensure they're always in stock
- Find underperforming items to consider removing or repricing
- Compare high-volume/low-price items vs low-volume/high-price items
- Understand category-level performance
TIP
This page is available to Admin users only.
What You'll See
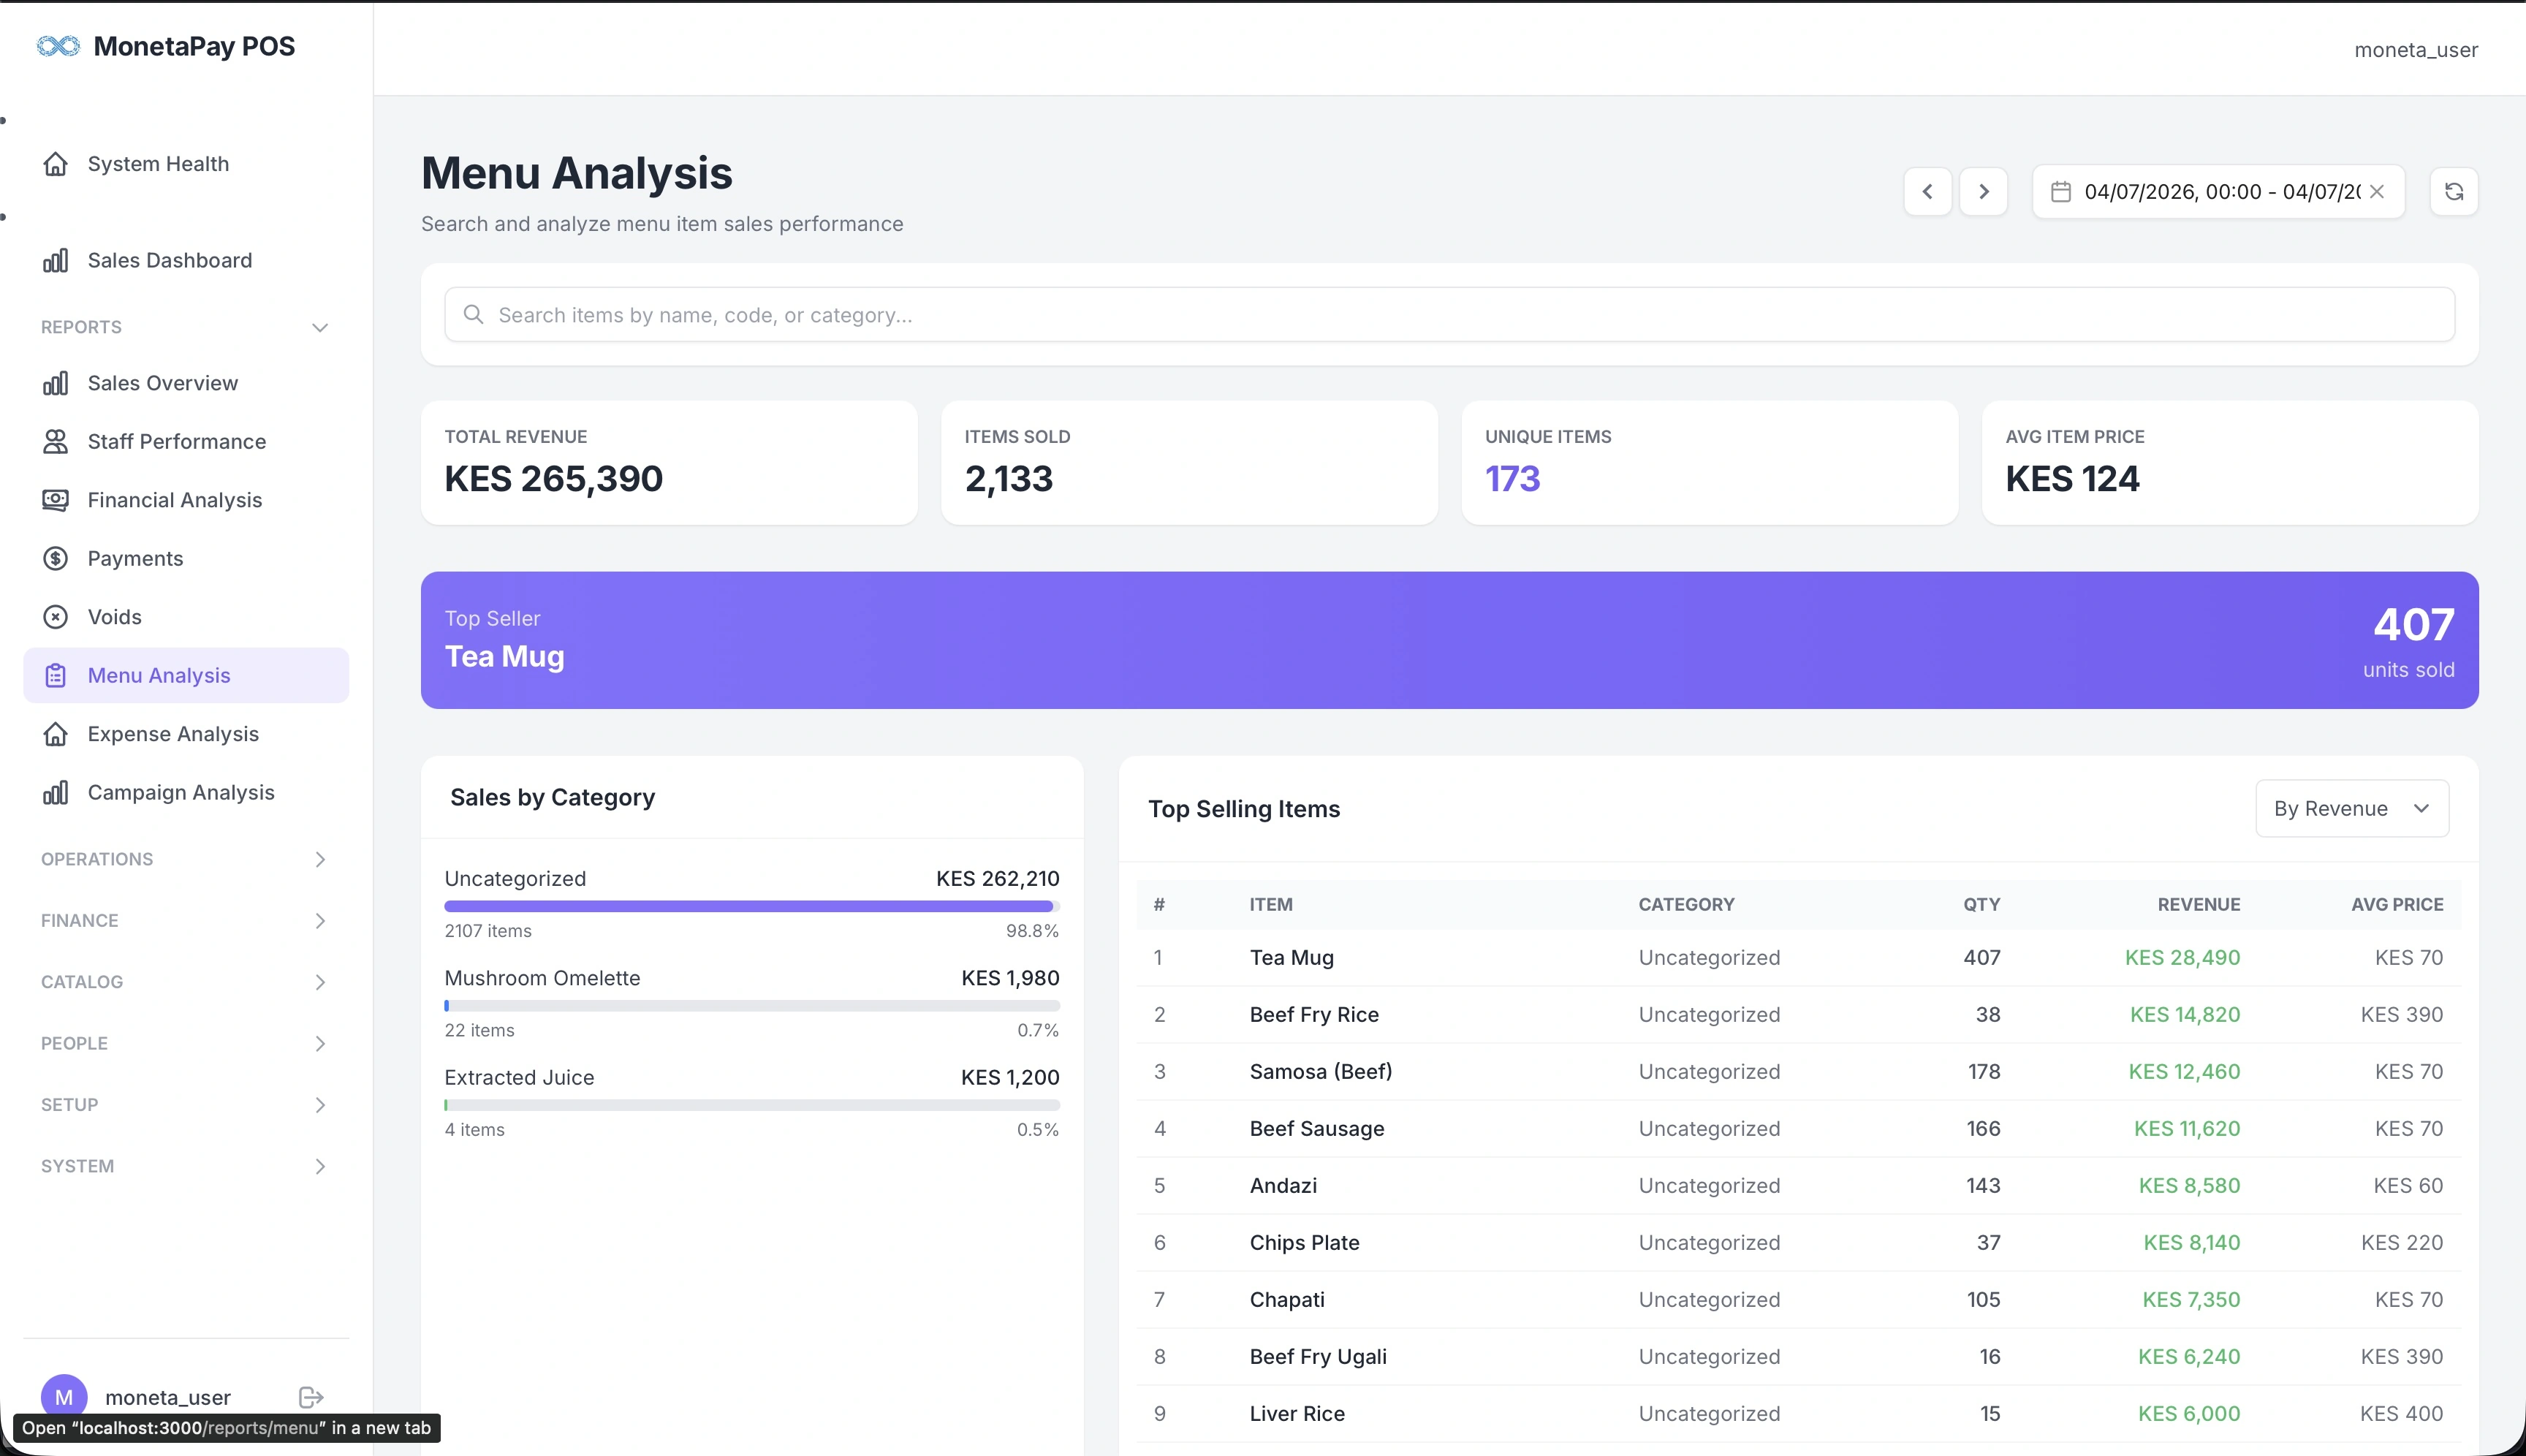
Summary Cards
| Card | What It Shows |
|---|---|
| Total Revenue | All menu item sales for the period |
| Items Sold | Total quantity across all items |
| Unique Items | How many different items were ordered |
| Avg Item Price | Average selling price per item |
Top Seller Highlight
A prominent banner showing your single best-selling item by quantity with unit count. This is the item you absolutely need to keep in stock.
Sales by Category
Revenue breakdown by menu category (e.g., Mains, Drinks, Desserts). Each category shows:
- Revenue total
- Quantity sold
- Percentage of total sales
Use this to see which categories contribute most to revenue and spot shifts in customer preferences.
Top Selling Items
A sortable, searchable table of all menu items:
| Column | Description |
|---|---|
| Item | Menu item name |
| Category | Menu category |
| Qty | Units sold |
| Orders | Number of orders containing this item |
| Revenue | Total revenue from this item |
| Avg Price | Average selling price |
Sort by revenue to find your highest-earning items, or by quantity to find your most popular items. Use the search box to quickly find a specific item.