Staff Performance
Per-waiter analytics — orders, revenue, rankings, and hourly heatmaps for team management.
Overview
Staff Performance is where you evaluate your team. It shows exactly how many orders each waiter took, how much revenue they generated, and when they were most active throughout the day.
Use this page to:
- Identify top performers and reward them
- Spot underperformers who may need additional training or support
- Plan shift schedules based on actual hourly activity data
- Compare waiter vs cashier contributions
What You'll See
Waiter / Cashier Toggle
Tabs at the top let you switch between Waiters and Cashiers views. The table and heatmap update to show data for the selected staff type.
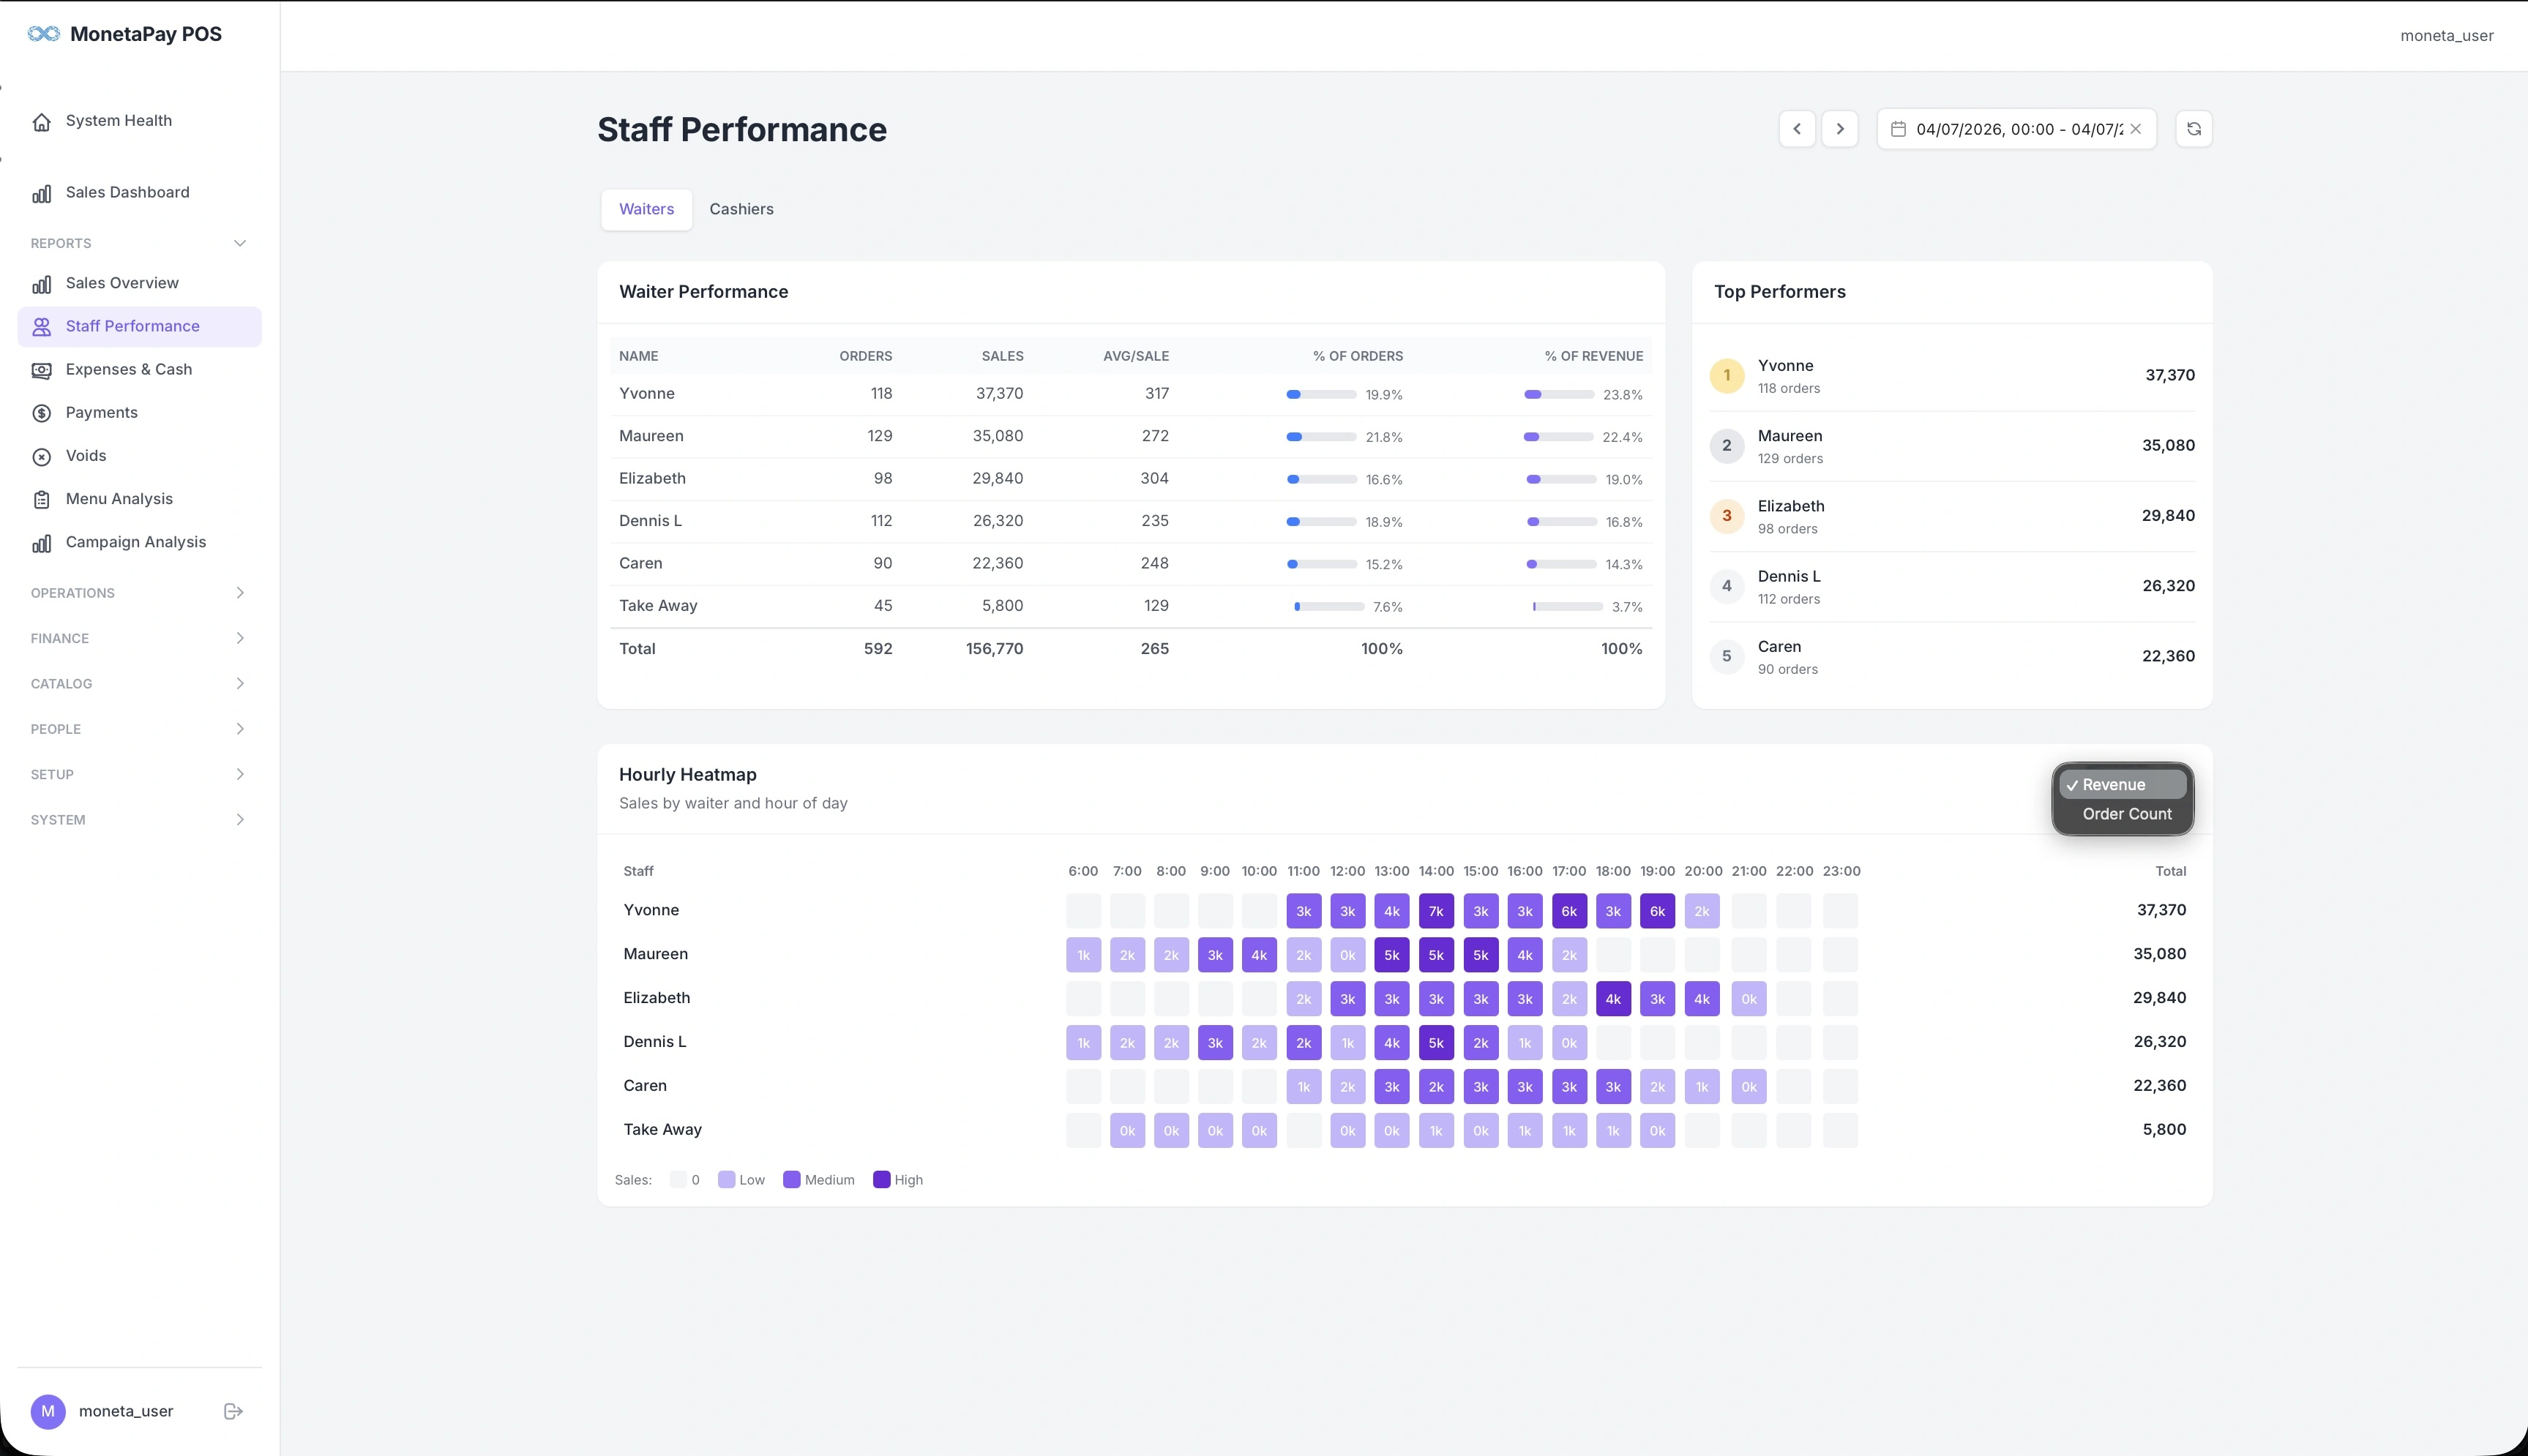
Performance Table
A detailed breakdown of each staff member's contribution:
| Column | Description |
|---|---|
| Name | Staff member name |
| Orders | Total orders taken |
| Sales | Revenue generated |
| Avg/Sale | Average order value for this staff member |
| % of Orders | Visual bar showing their share of total orders |
| % of Revenue | Visual bar showing their share of total revenue |
A Total row at the bottom sums all values. Use the percentage bars to quickly compare — a waiter with a high % of revenue but low % of orders is selling high-value items.
Top Performers
A ranked sidebar showing your top 5 staff members by revenue, with medal badges (gold, silver, bronze). Each entry shows the staff name, order count, and total sales.
Hourly Heatmap
A color-coded grid showing activity by staff member and hour of day (6am–11pm):
- Light cells — low activity
- Medium cells — moderate activity
- Dark cells — high activity
- Empty cells — no orders at all
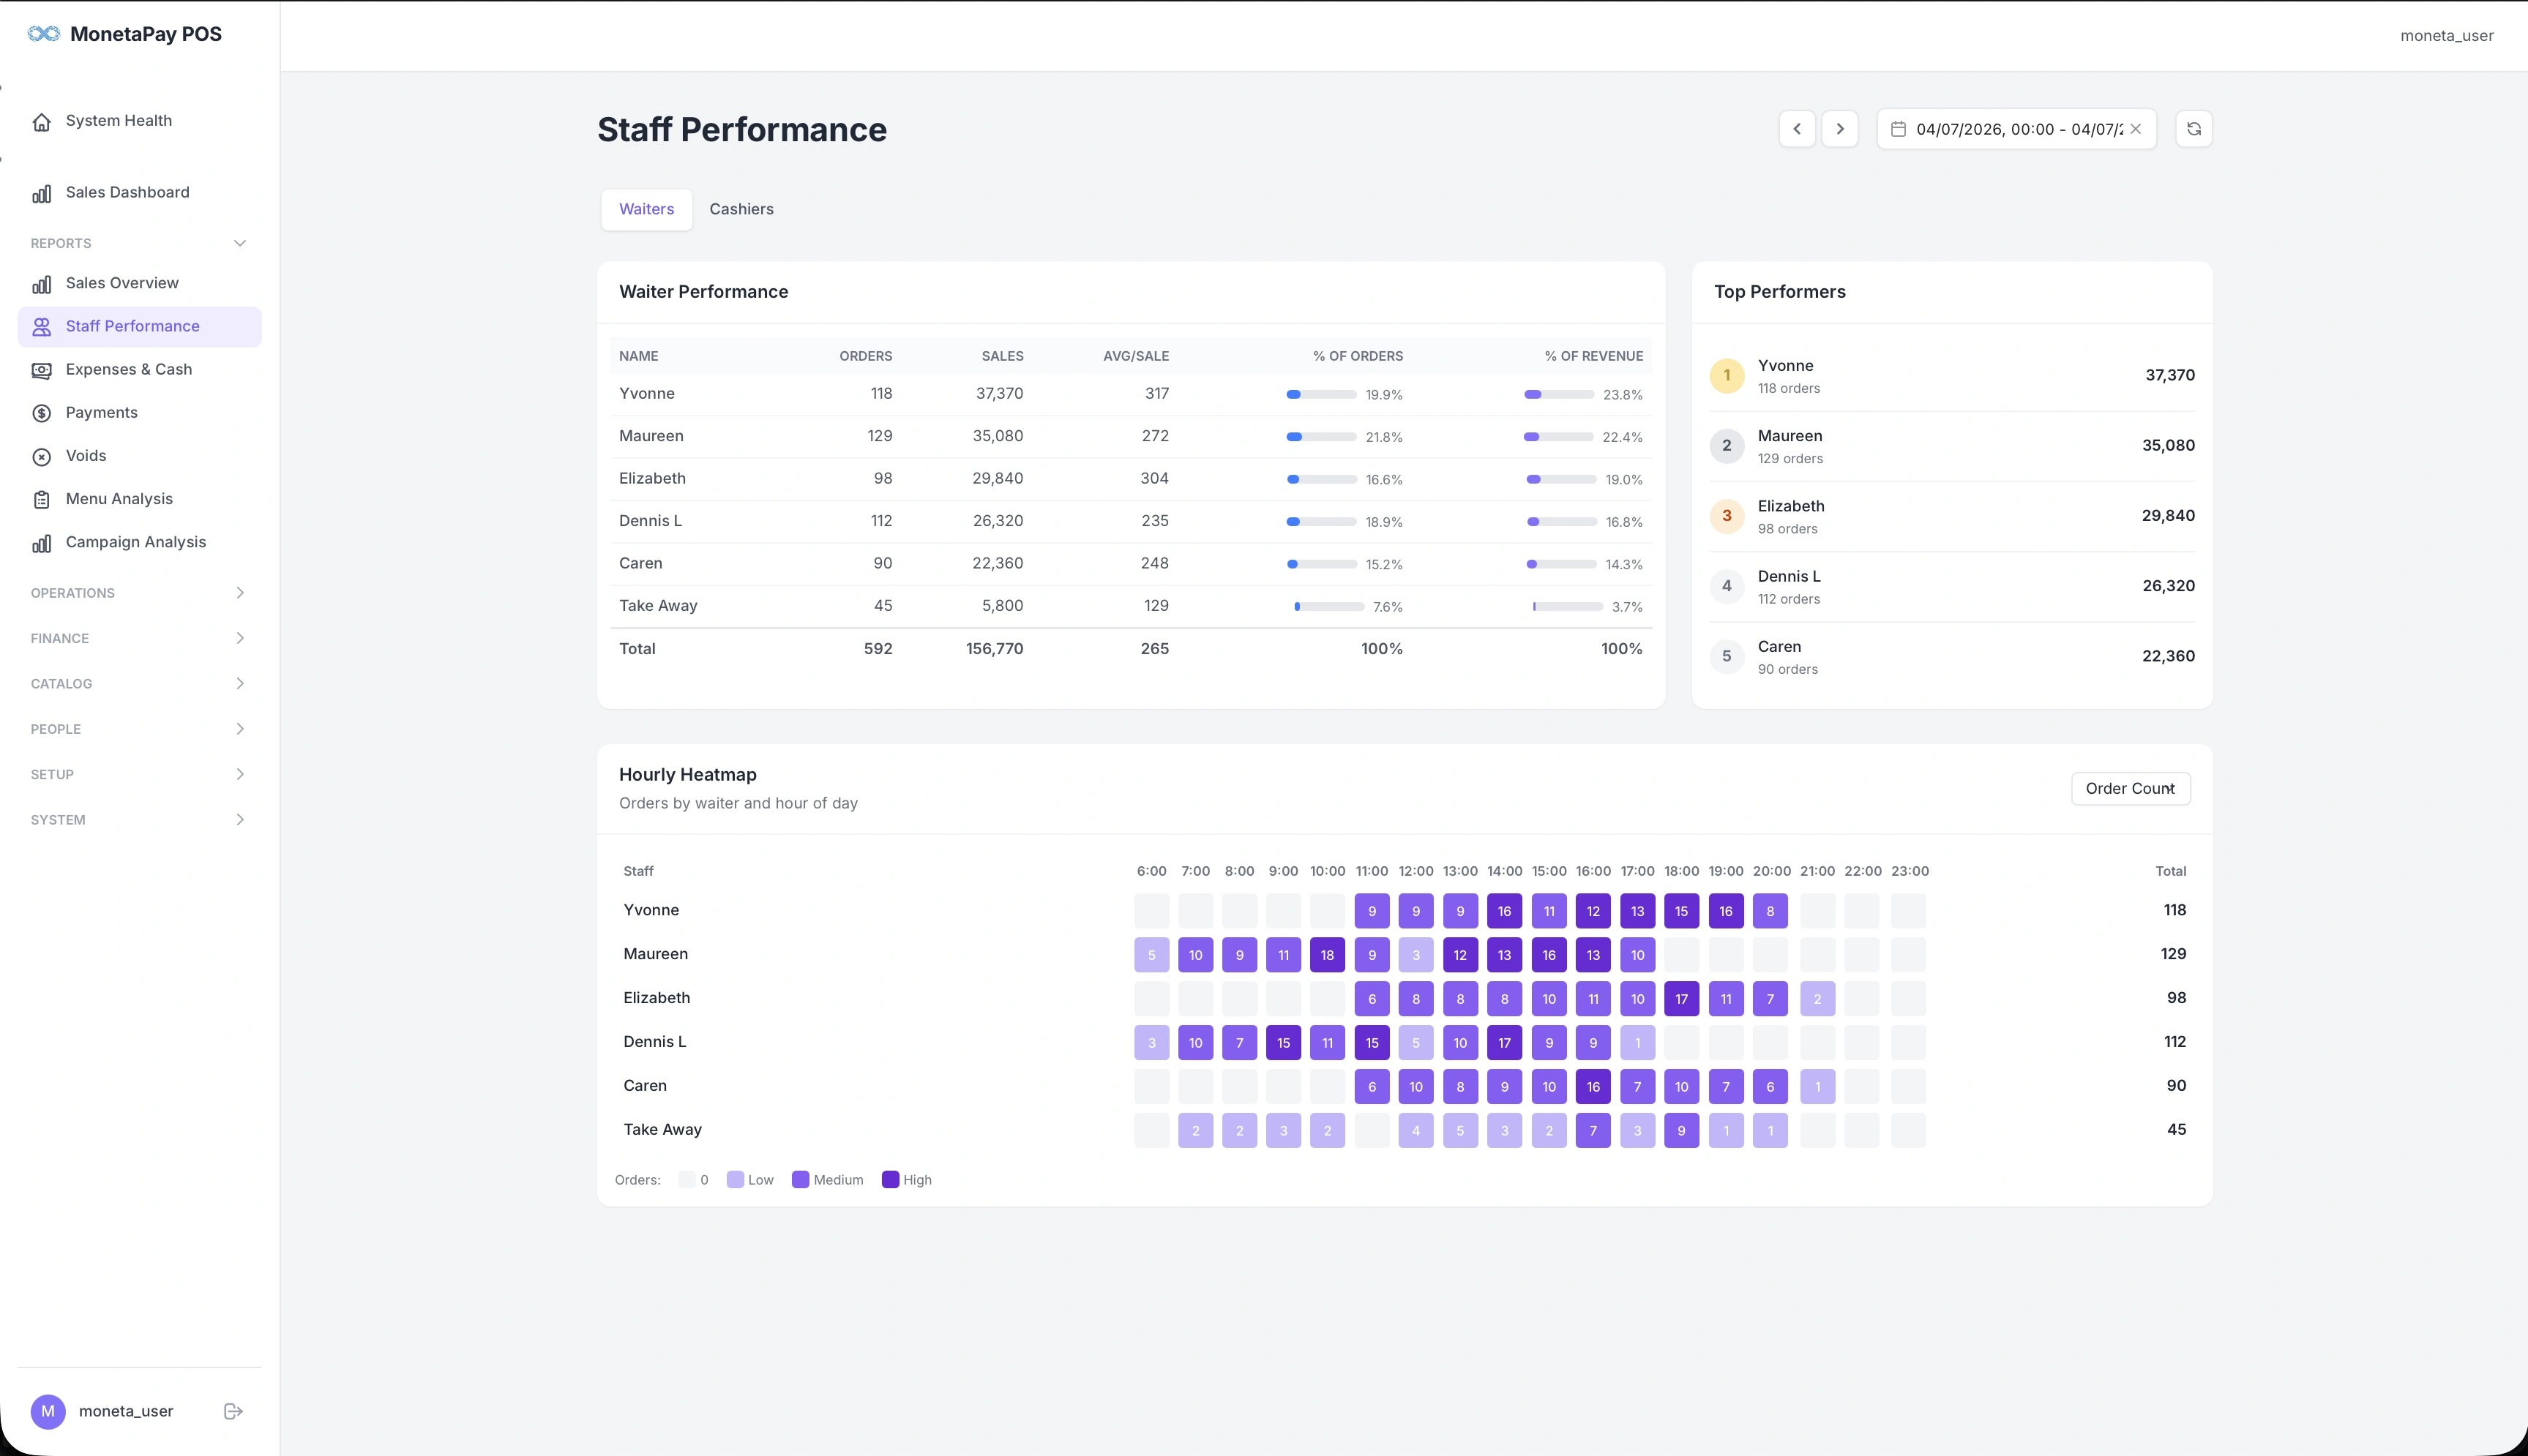
Toggle between Revenue and Order Count views using the button in the top-right of the heatmap. The total column on the right shows each staff member's daily aggregate.
How to use the heatmap:
- Spot coverage gaps — empty cells during busy hours mean you may need to adjust schedules
- Identify each waiter's peak hours — some staff may perform better during lunch vs dinner
- Compare consistency — a waiter with even color distribution is consistently productive
- For multi-day ranges, a daily heatmap (staff × date) is also shown
Access
Staff Performance is available to Operator and Admin users. Admin users see sales and revenue columns; Operators see order counts only.